How to visualize a Spring Integration graph with Neo4j?
Abstract
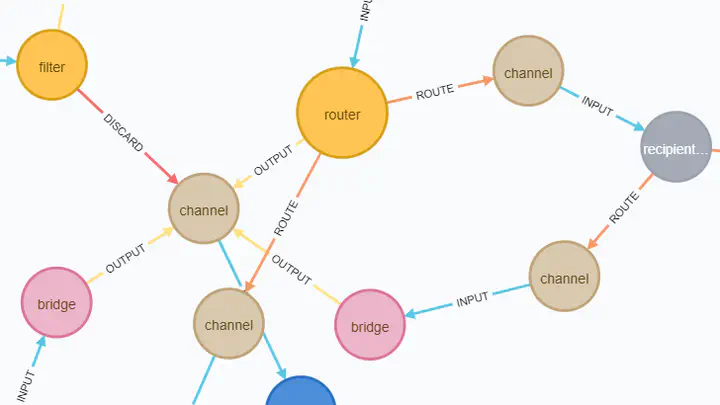
Spring Integration framework is able to represent the current state of all EIP components and their relations in the form of a JSON graph. It seems useful for learning and debugging but unfortunately none of the googleable tools (which are just 1st and 2nd) gives enough flexibility for visualization and analysis of such a graph. In this article I’ll show you how to address this problem by importing the graph into the Neo4j graph database where such abilities are the first class citizens.
Type
Publication
This article was also published on this site to improve its appearance. There is also Russian translation of the article.